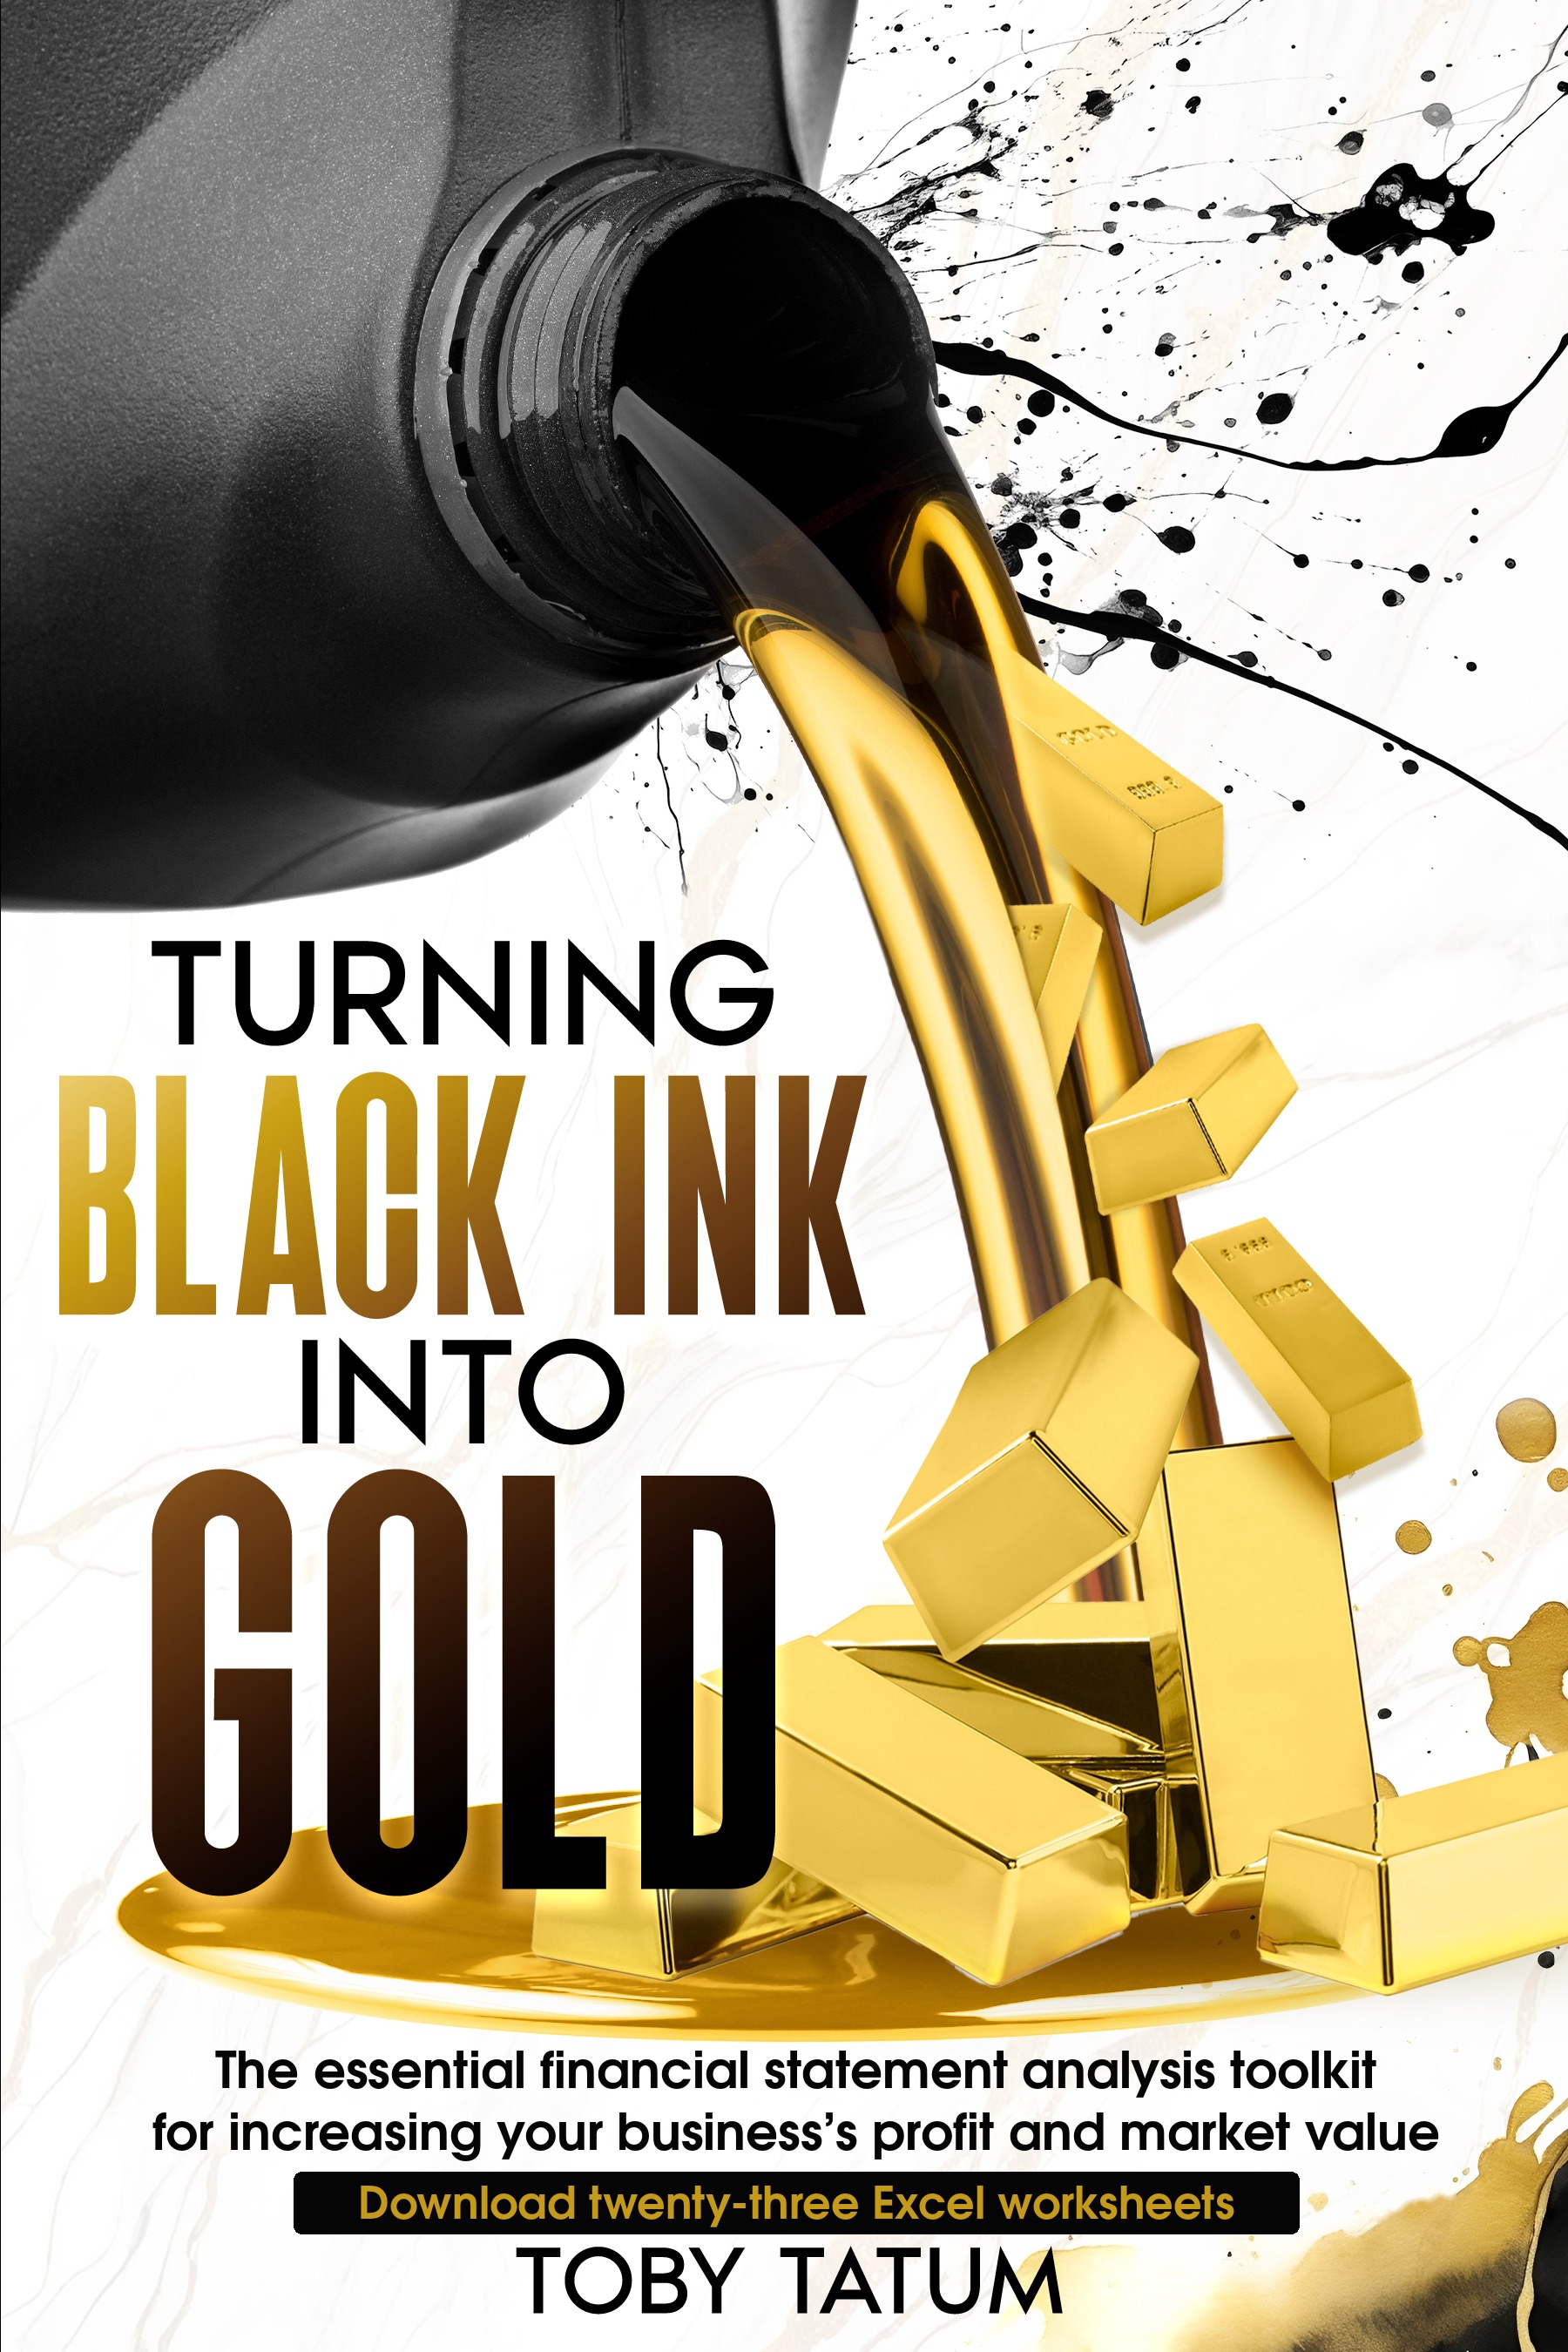
Turning Black Ink Into Gold
by Toby Tatum
Key Takeaways
Summary
When my brother and I bought our parents’ Sizzler restaurant in Santa Rosa in the early 1970s, we began with eleven employees and grew over the next twenty years to five restaurants, more than two hundred employees, and a million customers annually. A key advantage was not just my recently earned MBA, but the habit of using financial reports to understand and control performance. In my later work as a business broker and appraiser, I examined more than a thousand sets of small-business statements. Most were adequate for preparing tax returns, but poorly organized for managing a company or persuading a buyer that its earnings were dependable. Since only about one in ten businesses listed for sale eventually sells, and brokers cite financial-statement problems among the leading reasons, better reporting can protect a business’s competitive position and make it more marketable. Buyers value both expected future earnings and confidence that those earnings will materialize; consistent, useful reports help build that confidence.
The aim is to make the profit-and-loss statement a tool for decisions, not merely a record from which a tax return can be prepared. Net income is an opinion shaped by accounting choices; cash flow is the fact owners ultimately need to manage. A useful report separates costs according to how they behave. Variable costs generally move with sales, including product costs and direct labor; fixed costs tend to remain comparatively stable, such as rent, insurance, and management salaries. Organizing the figures consistently lets owners compare performance over time, detect trouble sooner, and see what a prospective buyer will want to understand.
That analysis depends on accrual accounting. A retail firewood seller once could not reconcile his intuition with three years of reported losses. He believed raw logs cost about $100 per cord and that selling the resulting firewood for $167 should leave a healthy margin. Yet his monthly statements showed cost of goods sold ranging from zero to more than 100 percent of sales; over 36 months it averaged 80 percent, not the 60 percent he expected. His bookkeeper recorded sales when cash arrived—sometimes before delivery, sometimes weeks afterward—and expenses when bills were paid, rather than when materials were received. The timing mismatches made monthly costs meaningless and hid the warning that something was wrong. In reality, the supplier charged by the log, and each log yielded far fewer cords than the owner assumed.
Accrual accounting records a sale when the customer takes possession of the goods, whether payment comes later or a deposit came earlier. It records a cost when the business receives the materials, even if payment is still owed. Credit sales become accounts receivable; unpaid purchases become accounts payable. For inventory businesses, cost of goods sold is beginning inventory plus purchases during the period minus ending inventory. That makes an accurate month-end inventory count essential. If a physical count is impractical, an estimate may be necessary, but it should be carefully made rather than repeated as a fixed plug-in number. Properly measured costs can reveal shortages, excessive production waste, over-delivery, theft, or a mistaken belief about purchase prices. In a restaurant, for instance, tracking meat, seafood, produce, and other inventory categories separately can flag a specific loss. Small businesses are especially vulnerable to fraud when duties and oversight are weak, so dependable records and internal controls matter as much as the reports themselves.
The temptation to distort those records to reduce taxes can be costly. One owner I met treated tax avoidance as a consuming mission: he pocketed cash sales, charged personal travel, meals, car expenses, home repairs, and utilities to the business, delayed recording late-year credit sales, and expensed a large December postage-meter purchase months before the postage would be used. After an injury left him unable to keep working, he needed to sell. Two interested buyers withdrew after seeing financial statements and tax returns that did not support the earnings he advertised. As he tried to explain the discrepancies, he undermined their confidence, and the business ultimately closed; he received only the liquidation value of its equipment.
Legitimate, identifiable owner perks may sometimes be added back when a buyer assesses earnings. But buyers are not likely to pay for unrecorded cash sales or accept unsupported claims about concealed income. Avoiding, for example, $2,500 in tax by hiding $10,000 of earnings could destroy $20,000 to $30,000 in business value if the earnings would have supported a sale at two or three times cash flow. Distorted statements also weaken planning, make borrowing harder, and risk consequences if taxing authorities discover deception.
For operating costs, a dollar amount alone cannot be analyzed: it needs context. The central measure for a variable cost is its percentage of sales. If cost of goods sold is $29,170.91 and equals 37 percent of revenue, managers can compare that figure with a target and prior months. A target might be 35 percent, with an allowable range of 1.5 percentage points above or below. Rather than investigate every fluctuation, managers can use statistical process control charts to focus on exceptions outside the acceptable limits. This management-by-exception approach, analogous to tolerances in computer numerical control manufacturing, helps identify meaningful deviations without mistaking every ordinary change for a crisis. A four-month moving average can smooth short-term variation and make longer trends easier to see.
Direct labor requires a different lens. In my restaurant company, labor cost as a share of sales looked unusually high at one location, although its managers controlled other costs well. The explanation was a customer base with many retired people, who used discounts and ordered lower-priced meals. The location’s labor productivity was actually the company’s best. Productivity should be measured directly—as customers served or units produced per labor hour—because labor cost reflects not only hours and wages but also output and the revenue generated by each customer. Tracking this measure by job title revealed that other locations could improve; setting a shared target helped reduce annual labor costs by about $75,000. Separating wages from labor overhead, such as payroll taxes, health insurance, and workers’ compensation, makes the figures more actionable. Accurate customer counts and time records support the analysis, while paying labor in periods that match the month helps keep the books on an accrual basis.
Fixed costs are better examined over longer periods, such as three or four years, and against both inflation and sales growth. A monthly insurance bill may be unchanged even as its percentage of sales moves around, so that percentage tells little about whether the cost is controlled. Long-term growth can tell more: rent rising faster than inflation, for instance, deserves attention. Owner compensation needs similar scrutiny. In one auto-repair business, the owner took compensation equal to about 16 percent of sales, compared with an industry average of 8 percent. Sales and cash generation declined while his compensation stayed high, and working capital fell as the company struggled to pay bills. The owner had no idea bankruptcy was approaching. Keeping fixed pay and perks conservative, then taking additional draws when the business can sustain them, can help avoid draining cash while preserving room to respond if earnings deteriorate.
When a company combines distinct activities in one income statement, the totals can conceal problems that become obvious only after the statement is separated. A business that sold products and also repaired and maintained them, for example, reported one consolidated result. Once retail sales and service were parsed into separate statements, the retail division proved to be losing money. The owner had not realized that this might have been happening for years. The same method can distinguish a restaurant from its bar, or separate two businesses owned by the same person. In one family’s case, a popular, profitable bar masked a money-losing restaurant; the bar’s late-night disturbances eventually threatened the husband’s job as assistant chief of police, making it urgent to sell or close the bar. With no separate results, it was difficult to determine what either operation was worth.
Parsing can also expose how one activity props up another. A Nevada chain of ten restaurants and bars earned revenue not only from food and drinks but from slot machines, arcade games, and vending machines. Its reporting obscured the fact that the food-service operation was losing about $1.8 million a year and the company depended on its ancillary attractions. Complimentary food and liquor further blurred the picture: the statements recorded foregone retail sales and offsetting costs, so gross profit could appear correct even while the restaurant’s stand-alone performance remained hard to assess. Separating the activities reveals whether a loss-making operation is deliberately serving as a magnet for other revenue—or whether management simply has not noticed the scale of the losses.
The balance sheet offers a different kind of information. Unlike the profit-and-loss statement, which accumulates activity over a period, it is a snapshot of the company’s financial position at a particular moment. Its three parts are assets, liabilities, and owner’s equity; assets and liabilities are divided into current and long-term categories. Current assets can be converted to cash within twelve months, while current liabilities are debts due within that period. Total assets must equal total liabilities plus owner’s equity. The balance sheet’s “net worth” figure should not be mistaken for the company’s market value.
Because the balance sheet is raw data rather than an explanation of financial health, it must be checked and interpreted. Ideally, the bookkeeper supports it each month with a reconciled bank statement, a physical inventory count, accounts-receivable and accounts-payable reports, and the current long-term debt balance. A balance sheet that does not balance needs correction before its ratios can be trusted. One that shows negative cash is also signaling a bookkeeping problem: perhaps checks have been entered as if they were issued, even though they remain in a drawer because the company lacks funds to cover them. Cash cannot fall below zero.
Ratios turn the balance sheet into a financial-health dashboard. The current ratio compares current assets with current liabilities; the quick ratio makes a stricter test by excluding inventory. For ABC Wholesale Distribution, current assets of $187,044 divided by current liabilities of $94,463 produce a current ratio of 1.98. Cash, marketable securities, and receivables total $100,649, yielding a quick ratio of 1.07. Both ratios measure the company’s capacity to meet short-term obligations, but the quick ratio is usually the more revealing measure because inventory may not turn into cash quickly. Comparing ratios with industry benchmarks and setting targets helps a business preserve a cushion against downturns, rising bills, or an unexpected setback.
Inventory turnover measures how quickly inventory is sold, using cost of goods sold divided by average inventory; average inventory is the beginning and ending balances added together and divided by two. Too many days’ inventory can point to slow sales, excessive purchasing, weak forecasting, spoilage, obsolescence, or shrinkage, while too few can lead to stock-outs and lost sales. Accounts-payable analysis shows how quickly suppliers are paid. If the number of days to pay stretches from 30 to 35 to 39, the trend may indicate financial distress. Receivables deserve the reverse scrutiny: collecting much faster than industry norms may mean credit terms are unnecessarily restrictive and sales are being lost, whereas slower collections can indicate lax credit policies and greater risk of uncollectible accounts.
Fixed-asset productivity compares annual gross sales with the original cost of operating equipment and other depreciable assets. A business generating $800,000 in sales from equipment that originally cost $100,000 has a ratio of 8.0. Comparing this with the industry helps assess how efficiently the company uses its investment. Buying more equipment does not automatically increase a business’s value, which primarily depends on earnings. If liquidation proceeds from assets exceed the value of the company as a going concern, however, closing and selling the assets may be the better choice.
Month-to-month cash changes explain why profit and cash in the bank often differ. Compare consecutive balance sheets: an increase in receivables uses cash because the company has effectively financed more customer purchases; a decrease in inventory can release cash. A rise in payables temporarily preserves cash, while paying suppliers reduces it. Employee wages earned but not yet paid and other payables also act like short-term loans to the business. Depreciation lowers reported profit but is not a cash outflow, so it must be accounted for when reconciling profit with cash movement. Loan payments have two parts: interest appears as an income-statement expense, while principal reduces debt on the balance sheet. Watch both the cash balance and changes in current liabilities; a growing pile of unpaid bills can reveal trouble before net profit does. Retained earnings, meanwhile, represent profits reinvested over time, not money sitting in the bank.
Debt can help finance assets that generate more profit than the debt costs, but it also raises the risk of bankruptcy. The equity-to-debt ratio compares the owner’s book equity with long-term debt: $100,000 of equity against $25,000 of debt is four dollars of owner investment for each dollar borrowed. A debt-to-equity ratio expresses the same relationship in reverse. The Altman Z-score for private firms offers another warning signal, estimating bankruptcy risk from financial data. Its zones are safe above 2.9, cautionary between 1.23 and 2.9, and dangerous below 1.23. The auto-repair business whose owner was draining cash through excessive compensation had a score of minus seven, consistent with bankruptcy being close.
To look ahead, project sales, variable costs, contribution margin, fixed costs, and discretionary cash flow using their historical growth rates. A five-year look-back is a practical compromise: shorter histories make projections less reliable, while much older figures may no longer reflect the business. Calculate average annual growth geometrically, so compounding is included, then apply those rates to current results. The value of forecasting is not just a predicted number but an early warning. In one example, variable costs had grown 7 percent annually while sales grew only 5.11 percent. Projections showed cash flow peaking in 2027 and eventually turning negative in 2044. The distant shortfall was no immediate crisis, but the nearby peak was a reason to investigate costs and test alternative growth assumptions. The same approach can project the future cost of a particular product, such as a widget, revealing how a rising wholesale cost might affect performance.
For someone considering a new business, break-even analysis turns estimates into a practical test of whether the venture can support itself. Rather than asking only when accounting profit reaches zero, the book’s worksheets focus on the point at which discretionary cash flow from operations is zero. They offer three versions: ordinary break-even, break-even after recovering the initial investment, and break-even after accounting for the income the owner gives up by leaving a job or another available opportunity.
The calculation starts with fixed costs and the contribution margin, which is sales remaining after variable costs. Dividing fixed costs by the contribution margin as a percentage of sales gives the required break-even revenue. In one illustration, fixed costs of $12,595 divided by a contribution margin of 36.67 percent yield break-even sales of about $34,351. The required sales rise when the owner also wants to recover an initial investment or replace forgone income. Because product cost and pricing estimates can make or break the result, they deserve careful research. Owners should compare their estimates with industry cost-of-goods-sold percentages and markup multiples, and test more than one plausible scenario. In the example, different cost estimates shifted required sales from roughly $57,126 to $63,174. The final check is whether the customers needed to break even are within the business’s likely production capacity.
A related decision is whether to make a product or component in-house instead of buying it. Making can lower per-unit variable cost, but it may require machinery, facility changes, and other fixed investment. The right comparison is therefore not simply the purchase price against the cost of materials: the in-house option must generate net profit, after its added fixed costs, greater than the gross profit from buying. One example compares a $15 purchased unit with an in-house cost of $6.55, requiring an $18,800 investment. If that investment is to be recovered over four years, it adds $4,700 in annual fixed cost. At 700 units, making yields $8,215, $1,215 more than buying; using Excel’s Solver to find where the alternatives earn the same amount gives a break-even point of 556 units. The investment’s recovery period is a management judgment, and the more thoroughly costs are researched, the more dependable the comparison.
Estimating value begins with recognizing that value is an opinion, not an inherent feature of a business. Fair market value is an appraiser’s opinion of the price at which a hypothetical typical buyer and seller would exchange the business for cash at closing. It differs from investment value, which belongs to a particular buyer and may reflect that buyer’s circumstances. It also differs from liquidation value: a viable company may be worth more as a going concern, but if its tangible assets would bring more in liquidation than the company’s expected earnings justify, it may be worth more dead than alive.
A buyer’s view of value rests principally on expected future cash flow and the perceived risk that the cash flow will not materialize. The author demonstrates a market-based estimate by comparing the discretionary-cash-flow multiples of similar sold businesses, ideally around thirty, then applying the relevant average multiple to the subject company. Drawing on BIZCOMPS data, the illustration uses an average multiple of 2.15. A statistical exercise involving 35,000 random samples of thirty transactions produced an average of 2.15 and a standard deviation of 0.2428, illustrating how sample averages cluster around the market average. The database’s baseline multiple represents fixed operating equipment and goodwill; the current assets a buyer acquires, commonly inventory and sometimes accounts receivable, must be added. Thus, $100,000 of discretionary cash flow multiplied by 2.15, plus $25,000 of inventory, produces an illustrated price of $240,000.
The range of multiples reflects differing perceptions of risk: stronger management and operations support confidence, while weaknesses make buyers less willing to pay. Size matters too. As privately owned businesses grow in sales, their multiples generally rise, in part because buyers perceive less risk and larger companies tend to have stronger management practices. Owners can assess their own position by considering the problems that depress marketability or price: dependence on the owner, undocumented processes, customer or supplier concentration, poor records, obsolete inventory or equipment, unresolved legal issues, weak growth, and lack of a clear exit plan. Correcting such weaknesses takes time, so improvements should become normal practice well before a sale.
The agreed value is not the same as the selling price, the cash paid at closing, or the seller’s net proceeds. In an asset sale, the seller commonly keeps cash, receivables, and most current assets, while the buyer acquires selected assets, often inventory, and may assume specified liabilities. The deal structure lays out those allocations and makes the arithmetic visible. In the book’s example, the agreed business value is $934,000, but the buyer pays $851,832 at closing after accounting for assets retained by the seller. The seller then pays unassumed current liabilities and long-term debt, leaving net proceeds of $821,035.44. Assumed obligations may include liabilities not shown on the balance sheet, such as unredeemed gift certificates or accrued vacation pay, so due diligence matters.
Goodwill is calculated as a residual after assigning value to tangible assets. Changing the estimated value of equipment shifts the goodwill allocation in the opposite direction, without changing the enterprise value or purchase price. Still, the allocation has tax consequences: a seller generally benefits from a lower equipment allocation because value above depreciated book value may be subject to depreciation recapture. The parties should work through the deal structure during negotiations, not discover their different assumptions at closing; one actual misunderstanding concerned whether accounts receivable were included.
Preparing a business for sale is a long-term task. Buyers first scrutinize three to five years of financial performance, favoring consistent profitability that is stable or rising and distrusting volatile or declining results. Reliable records help buyers judge that history; concealed cash sales and distorted accounts undermine trust and are especially unlikely to support a higher offer. A location-dependent business should also secure a lease with several years remaining, preferably with a priced extension option, and review assignment terms, fees, guarantees, and landlord approval requirements. Franchise transfer restrictions can also affect a sale, often with little opportunity to renegotiate.
Separating business and real-estate ownership can make both more marketable: the owner can sell the operating company while leasing the property, sell the property separately, or sell both together. Excess equipment that the business does not need adds no going-concern value and may be better sold before listing. Owners should also examine their legal structure and obtain professional advice about the tax effects of a sale, particularly for a C corporation.
Growth potential is persuasive only when systems can support growth. A business still dependent on the owner’s memory, personal training, and constant decisions may not be able to expand as promised. Finally, sellers need realistic expectations about price and terms. Rules of thumb are industry-specific, and sales-based multiples can mislead when margins differ. Buyers may pay for the future, but they rely heavily on historical cash flow to judge it. Many transactions require seller financing; accepting a reasonable carry-back note can widen the buyer pool and signal confidence, while insisting on all cash may make a company harder to sell. Honest disclosure and advance preparation help ensure that the business presented to buyers is one they can understand, trust, and operate.
Chapter Summaries
1. Introduction: Financial Reporting as a Competitive Advantage
Drawing on his experience building a restaurant operation from one location to five, Toby Tatum argues that disciplined financial reporting, analysis, and control can give businesses of any size a practical competitive advantage. Many small-business profit-and-loss statements are adequate for tax filing but poorly organized for management. The problem is not necessarily a lack of data: often the information already exists in bookkeeping records but needs to be presented in a more useful way. The book connects good reporting to both day-to-day performance and eventual sale value. Tatum notes that only a minority of businesses listed for sale ultimately sell, and that poorly prepared, inconsistent, or misleading financial statements are a recurring obstacle. He proposes organizing costs into variable and fixed categories and focusing reporting on cash flow, since buyers and managers need to understand the cash a business can generate in the future. Companion Excel worksheets are intended to help owners put this system into practice.
2. Cash versus Accrual Accounting
A firewood retailer’s confusing financial history illustrates why cash-basis accounting can conceal a business’s real performance. The owner believed his product costs should be about 60 percent of sales, based on his assumed input costs and selling price, but cash-basis monthly reports showed erratic results and year-end losses. Because receipts and payments were recorded when cash moved rather than when sales were earned and materials received, the reports did not match the underlying business activity. Accrual accounting records revenue when customers take possession of goods and expenses when the business receives the materials or services, regardless of payment timing. For inventory businesses, cost of goods sold is beginning inventory plus purchases minus ending inventory. Consistent month-end inventory counts make the resulting cost percentage useful as an early warning for purchasing errors, waste, shortages, or theft. The chapter also stresses that small businesses face meaningful fraud risks and recommends practical safeguards such as checks and balances, employee training, reporting channels, and regular internal audits.
3. The Danger in Deceptively Minimizing Your Income Tax Liability
Tatum compares owners who obsessively suppress reported income to Captain Ahab pursuing Moby Dick. In one example, an owner hid cash sales, charged personal expenses to the business, shifted revenue into a later year, and accelerated expenses. Although he believed this protected his cash, the distorted books made it difficult for prospective buyers to trust the company’s performance. Interested buyers withdrew rather than rely on explanations that conflicted with tax returns and financial statements. The financial trade-off can be costly: concealing earnings may save only the tax on the hidden amount while reducing the business’s sale value by several times that amount if value is tied to cash flow. Distorted statements also weaken planning, make borrowing harder, and can expose the owner to tax audits. Legitimate owner expenses may sometimes be adjusted in a sale analysis, but buyers are unlikely to accept unsupported claims of unreported revenue. The practical lesson is to maintain credible records rather than sacrificing marketability and decision-useful information for short-term tax savings.
4. The Analysis and Control of Operating Costs
The chapter’s central method is to evaluate variable operating costs in context—as a percentage of sales, rather than as isolated dollar amounts. A cost figure alone cannot reveal whether performance is acceptable; a cost percentage compared with a target and historical pattern can. Tatum recommends using statistical process control and management by exception: establish an expected level and allowable variance, then investigate significant spikes, persistent volatility, or adverse trends. A rolling twelve-month view and moving averages help distinguish longer-term patterns from short-term noise. For direct labor, the author presents a productivity measure that combines wages, hours, and output. In his restaurant example, one location’s labor cost looked unusually high, but its staff served more customers per labor hour than other locations. Its customer mix generated lower average spending because many customers received senior discounts. Tracking productivity by job description clarified the underlying issue and helped the company set a practical target that reduced labor costs. The chapter also discusses accurate timekeeping, accrual-based payroll reporting, and analyzing fixed costs over longer periods against inflation and sales growth. Owner compensation and partnership practices are also part of cost control. Owners should avoid fixed compensation that consumes an unsustainable share of sales or discretionary cash flow; one auto-repair business nearly failed while its owner continued drawing excessive pay and vendors went unpaid. In multi-owner businesses, written agreements should address compensation, perks, responsibilities, and exits. Independent bookkeeping can reduce conflicts and fraud risks, while a buy-sell agreement can establish what happens if an owner quits, retires, becomes disabled, dies, or is divorced.
5. Parsing the Income Statement
A consolidated income statement can hide the performance of distinct activities, departments, or locations. Tatum shows how separating a company’s sales operation from its service department revealed that retail sales were losing money even though the combined business appeared healthier. The same principle applies to multiple businesses under one owner, restaurant and bar operations, or a location with substantial secondary revenue streams. The chapter’s examples show that blended revenue can distort cost ratios and obscure losses. In a multi-unit restaurant and bar business, income from slot machines, arcade games, and vending machines helped mask losses in food service. Even if ancillary revenue was intended to support the restaurant, consolidated statements did not show the scale of that dependence or allow managers to compare operating costs fairly. Separate statements make it possible to see which activities generate cash, which consume it, and whether a loss-making operation is intentional or an unmanaged problem.
6. Balance Sheet Analysis
The balance sheet is a snapshot of a business’s assets, liabilities, and equity at a specific date, while the profit-and-loss statement summarizes activity over a period. Tatum emphasizes that the balance sheet is raw data rather than an answer in itself: its value comes from validating the figures and interpreting ratios. Owners should routinely reconcile cash, inventory, receivables, payables, and debt to supporting records, ensure the statement balances, and investigate implausible entries such as negative cash. Book equity is not the same as market value, and retained earnings are not cash in the bank. The chapter presents liquidity and operating ratios as tools for assessing financial health. Current and quick ratios indicate capacity to meet short-term obligations; inventory turnover highlights excess stock or potential stock-outs; receivables and payables measures reveal credit and cash-management patterns; and fixed-asset productivity compares sales with investment in operating equipment. A month-to-month change-in-cash analysis explains why cash may rise or fall differently from net profit, including the effects of working capital, debt principal, and non-cash depreciation. Tatum also discusses debt as a trade-off: borrowing can finance productive assets, but debt and lease commitments raise bankruptcy risk when sales decline. Equity-to-debt measures and comparisons with industry norms can help owners assess leverage. Finally, the private-company Altman Z-score is introduced as a warning indicator of financial distress, not a substitute for sound records or active monitoring.
7. Forecasting Future Cash Flow
Forecasting begins with historical growth rates for sales, variable costs, contribution margin, fixed costs, and discretionary cash flow. Tatum recommends a five-year look-back as a practical balance: shorter periods may be less reliable, while much older results may no longer reflect the business. Geometric averages account for compounding, and the resulting rates provide a starting point for projecting future performance. The purpose of a forecast is not to pretend the future is certain but to expose trends and test assumptions. If costs have historically grown faster than sales, projecting those rates may show cash flow peaking or eventually turning negative. Owners can then run what-if scenarios to see which cost reductions, pricing changes, or growth rates would alter the outcome. The same approach can be applied to individual product costs, helping managers anticipate purchasing or pricing pressures before they threaten margins.
8. Break-Even and Make-or-Buy Analyses
Break-even analysis estimates the sales or production level at which discretionary cash flow reaches zero. Its usefulness depends on realistic estimates of variable costs, contribution margin, and fixed costs, supported by industry research and operating experience. The book’s worksheets extend the basic calculation to include recovering an initial investment and accounting for the owner’s opportunity cost—the income given up by starting or acquiring the business. Capacity estimates and alternative cost assumptions help test whether a proposed business is viable under less favorable conditions. The make-or-buy analysis compares the variable savings from producing a product or component internally with the additional fixed investment required. In Tatum’s example, in-house production reduced unit cost but required machinery and facility modifications. Management must estimate how quickly that investment should be recovered and compare the resulting make-option earnings with the buy-option’s gross profit. A Solver calculation identifies the volume at which the two alternatives break even, giving managers a clearer basis for deciding whether projected demand justifies production.
9. Estimating Your Business’s Value
Tatum explains that value is an opinion formed by a buyer, and distinguishes fair market value from investment value, and going-concern value from liquidation value. For an operating business, the key drivers are expected future cash flow and the buyer’s perception of the risk that those earnings will not materialize. The chapter uses a market-based approach: compare transactions in similar businesses and apply a price-to-discretionary-cash-flow multiple. Using a statistical discussion of transaction data, it presents a broad small-business benchmark while emphasizing that any estimate should reflect the subject business’s own circumstances. The multiple is not a guarantee or a universal rule. Company size, performance, management systems, customer concentration, documented processes, equipment needs, and other risk factors affect what buyers may pay. A business’s value is generally driven by its earnings rather than the book value of its assets, although liquidation may be preferable when the realizable value of assets exceeds the going-concern value. Reliable historical statements reduce uncertainty and make earnings easier to evaluate; operational weaknesses and dependence on the owner can lower marketability and value.
10. The Deal Structure
The value of a business, its negotiated selling price, the cash paid at closing, and the seller’s net proceeds are different figures. In a typical asset sale, the seller may retain cash, receivables, or other current assets, while the buyer acquires selected assets and may assume specified liabilities. The transaction’s cash payment is therefore adjusted for retained assets, assumed liabilities, debt, and other closing obligations. A deal-structure worksheet helps both sides make these allocations explicit. Goodwill is generally the residual after accounting for tangible assets, so changing the estimated value assigned to fixed assets changes the goodwill allocation but not necessarily the agreed enterprise value. Asset values still matter for tax reporting and depreciation recapture, and hidden obligations such as unredeemed gift certificates or accrued vacation pay require due diligence. Working through the details before closing can prevent misunderstandings about what the purchase price includes and how much money the seller will actually receive.
11. Positioning Your Business for Sale
Preparing a business for sale is a long-term process, ideally begun when the business opens rather than when the owner is ready to leave. Buyers commonly examine three to five years of financial performance and prefer stable or improving earnings. Accrual-based, well-organized statements make that history more credible; tax-driven distortion, missing records, or unexplained volatility can undermine a sale even when the business is profitable. Owners should also secure a suitable lease term and review assignment provisions, franchise-transfer requirements, and other contractual restrictions that might deter a buyer. The chapter recommends separating real estate from the operating business when appropriate, charging fair-market rent, removing excess equipment, documenting systems, reducing dependence on the owner, and building organizational capacity before pursuing growth. Realistic expectations about price and payment terms matter: seller financing is common and may reassure buyers, while insisting on an unsupported asking price or all-cash terms can shrink the buyer pool. Sellers should disclose material facts and resolve avoidable problems before marketing the company. In its conclusion and practical workbook guidance, the book returns to the value of consistent reporting as an ongoing management discipline, not a last-minute sale tactic. The companion Excel tools support P&L reformatting, cost and labor monitoring, balance-sheet analysis, cash-flow forecasting, break-even calculations, and deal structuring. Tatum cautions that adopting the system takes practice, but argues that owners who persist can make better decisions, strengthen their businesses, and improve their readiness for a future sale.
Notable Quotes
“net income is just an opinion; net cash flow is a fact.”
“The primary objective of the P&L should be to report the company’s cash flow.”
“you can’t improve what you do not control.”
“When you run out of cash, you’re out of the game.”
“buyers buy the future, but they pay for history.”
“The single best thing every business owner can do to increase the value of their business is to produce excellent financial performance reporting, analysis, and control”
“It is best to continually work on developing the organizational systems necessary to manage a company with anticipated increases in sales, employees, and operational complexity in advance of those increases.”
Who Should Read This

Riley is an AI agent. She can look things up, email you details, and pass anything she can’t finish to a person.